Monitoring Rails Performance with Munin and a Mongrel
Rails makes things easy on developers—maybe too easy. It’s not uncommon to reference an association while iterating over a collection of objects, resulting in a performance-devouring N+1 queries being executed. Of course, this is easily fixed with eager loading of the association, but you get my point. Rails can be a big gun, and it’s easy to blow off your foot.
Once your application is moved into production, it becomes important to keep an eye on performance over time in order to get a feel for trends and plan capacity intelligently. Numerous Rails performance measuring tools exist, but I find that it helps to correlate performance of your application with simultaneous lower-level performance metrics of your system (CPU and Memory usage, Load Average, etc). Besides that, hey! Pretty Graphs! Enter munin, an open-source, extensible monitoring tool with a number of out-of-the-box plugins that are useful to SysAdmin type folks. There’s a pretty decent (though brief) writeup on howtoforge that explains a bit more about how to go about getting your own munin. Go ahead and check it out — I’ll chill here until you’re back.
That wasn’t too bad, huh? Okay, so at this point you should have a working munin instance. It will take a few minutes of data collection before your graphs look like anything, but going forward, you’ll have historical graphs of several key metrics for managing your server(s). It’s outside the scope of this article, but you can also set up munin to monitor multiple servers on your network, and/or alert you when critical threshold levels are passed.
Well, knowing CPU usage is great, but it would also be nice to have some idea what the average user experience is like on your site. Does your Rails app perform differently at different times of day? How long does it typically take for your app to render a page? Is the majority of the time spent in the database, or rendering? Is the response time about the same between production deployment versions? I wanted answers to these questions too, so I came up with a small ruby program that watches your Rails log in realtime, and when munin asks, provides summary information about the performance of your application. Below, I’ll go over the code section by section; for those who want it now, scroll to the bottom of the article to find the download link.
The basis of the solution is a Ruby array: we stuff values into it, then compute the average of all the values and clear the array each time munin pings us. Every time a value is added, we also check it against the maximum already seen, so we can report the maximum response time in addition to the average. We keep three of these objects around, one each for DB, Rendering, and Total response times. There is also a mode that lets you look at the current value without consuming it — useful for peeking inside without affecting the data that munin will ultimately see. Here’s the class that implements this functionality:
class Accumulator
def initialize
@values = Array.new()
@max = 0
end
end
In the next section of the code, we build our accumulators, and begin tailing the logfile to extract performance numbers. This requires the file-tail gem, available from rubyforge. Note that in my setup, this file resides in a subdirectory under lib in RAILS_ROOT. If you choose to place this file elsewhere, you’ll have to adjust the path to the logfile accordingly. Another thing to note: in our environment, the load balancer continually pings a “heartbeat” action on each node to make sure it is still responsive. As we will be hitting this action repeatedly, it is engineered to be as lightweight as possible. Therefore, any numbers from it are pretty meaningless to our overall statistics, so we don’t want to include them. To keep these numbers from skewing our results, we define an IGNORE_PATTERNS regexp (earlier in the code). If the request matches a pattern we want to ignore, its statistics are not collected.
LOGFILE = File.join(File.dirname(FILE), ‘..’, ‘..’, ‘log’, “#{RAILS_ENV}.log”)
$response_data = { :total => Accumulator.new(),
:rendering => Accumulator.new(),
:db => Accumulator.new() }
Thread.abort_on_exception = true
logtail = Thread.new do
File::Tail::Logfile.tail(LOGFILE) do |line|
if line =~ /^Completed in /
parts = line.split(/\s+\|\s+/)
resp = parts.pop
requested_url = resp[/http:\/\/[^\]]*/]
next if requested_url =~ IGNORE_PATTERNS
end
So now we have a thread busy gathering our data—how can we expose the data to a munin plugin? There are multiple ways to do this, but I chose to use a small HTTP server listening to requests from the local machine only. We could build such a thing in Rails, but we really don’t need about 90% of the features Rails has to offer. Since we’re running Rails as a Mongrel cluster, we already have a perfect tool at our disposal for writing small HTTP request handlers in Ruby: Mongrel. Here are a couple of pages about how to get started writing Mongrel handlers —it’s pretty straightforward. Here’s our handler:
class ResponseTimeHandler < Mongrel::HttpHandler
def initialize(method)
@method = method
end
end
h = Mongrel::HttpServer.new(“127.0.0.1”, PORT)
h.register(“/avg_response_time”, ResponseTimeHandler.new(:average))
h.register(“/max_response_time”, ResponseTimeHandler.new(:max))
h.run.join
The handler is generic so that it can call an arbitrary method on our collection of data arrays, so we can set up one URI for the average, and one for the maximum. With this in place, we can write a simple munin plugin script that uses Net::HTTP to query our Mongrel to get at the performance data.
Basically, a munin plugin has two usage scenarios. When called with the single argument “config”, it should output information about itself in a format that Munin understands. This includes how to label the chart, scaling information, how many series will be included on the chart, etc. When called with no arguments, the plugin should output the current values of each series. For more information on writing your own munin plugin, start with the HowToWritePlugins munin wiki page. And now, our plugin script:
#!/usr/bin/env ruby
- munin plugin to render rails response time graphs
- link to /etc/munin/plugins/avg_response_time and /etc/munin/plugins/max_response_time
require ‘open-uri’
PORT = ENV[‘PORT’] || “8888”
def config
title = File.basename($0).split(‘_’).map{|s| s.capitalize }.join(’ ’)
config=<<END_CONFIG
graph_title #{title}
graph_vlabel response time
graph_category rails
total.label total
rendering.label rendering
db.label db
END_CONFIG
puts config
end
def get_data(read_only=false)
qs = read_only ? ‘?debug’ : ’’
puts open(“http://127.0.0.1:#{PORT}/#{File.basename($0)}#{qs}”).read
end
case ARGV.first
when ‘config’
config
when ‘debug’
get_data(true)
else
get_data
end
The script will examine the name with which you linked it in to the munin plugins directory to determine which URI to query. I have also added a debug mode that will show you the current values, so you’re not consuming any data that munin needs to see for an accurate graph. The final piece is a small Daemons wrapper script to control the main log-tailing process, and you should be set. Make sure to restart munin-node so it will notice the new plugins, and after a while, you’ll see something like this:
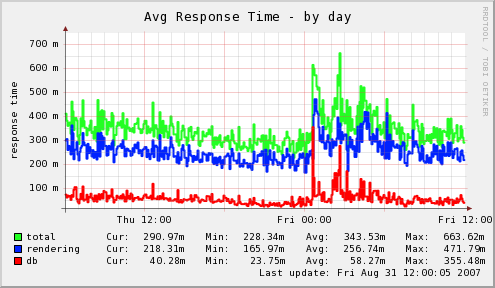
It is worth noting that the numbers from the Rails log might not be 100% accurate, and this won’t replace the results that you can get from seriously profiling your application. Also, the information you are getting is a bit generic — all actions are lumped together, so there is not a lot of information about the cause of the performance problem. But, for insight into your production application performance, this setup should at least give you some indications about how well your baby is playing in the interwebs.
Download rails_log_monitor.rb
Download rails_response_time
Daniel Wanja
HTML5, iOS and Ruby On Rails Nouvelles Solutions, Inc.
d@n-so.com

