Analyzing the Subversion logs from the Rails project with mx:OLAPCube
I started playing with Anthony Eden’s ActiveWarehouse and followed his excellent tutorial on how to analyze the Ruby On Rails Svn Commit Log with the ActiveWarehouse framework. Of course this made me want to try to do the same with the new mx:OLAPCube and mx:OLAPDataGrid provided by Flex 3 as part of the DataVisualization components. Let me just say this…I am not done playing with either the Flex OLAPCube nor the Rails ActiveWarehouse framework as these are pretty complex beasts. Both of these frameworks are overlapping and complementary. There are overlapping as both can digest raw data and perform aggregation of that data. They are complementary in the sense that a server side warehouse needs a good visualization front-end. Maybe the OLAPCube and OLAPDataGrid can be this front-end. In my initial trials I haven’t come up with a compelling way to integrate both, but by using some simple SQL I could extract the data from the ActiveWarehouse and pass it to the OLAPCube.
Before going on you may want to read Anthony’s blog and check his presentation on Data Warehouses with ActiveWarehouse. I didn’t find much information on the Flex OLAPCube besides these: Feature_Introductions:OLAPDataGrid on Adobe’s labs, Flex 3: Feature Introduction Video for OLAP Support, and these beta2.zip">Flex examples.
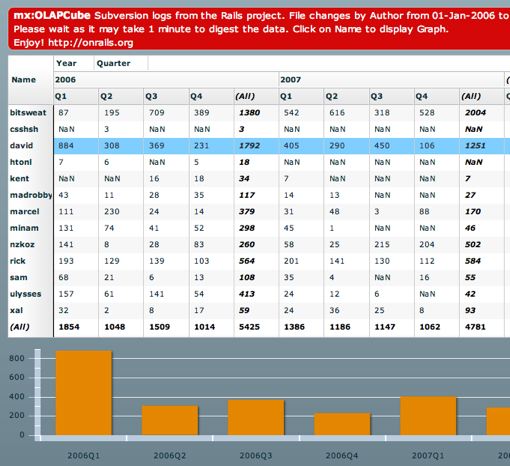
So I create the following sample application. You can try it out here. Note it’s pretty slow, it takes up to a minute to aggregate 10000 values. The Flex team mentioned they didn’t optimize this component yet. I can confirm this. But I may also have messed something up as these are only my initial steps with that component. The application displays the Author dimension with the Author Name as rows and the Time dimension with the Year and Quarter as columns. The facts is the File Change count during that period. Flex calls the “facts” a measure.
Run the applicaiton
To extract the data from the ActiveWarehouse I created this SQL to join the facts table with all the dimensions table. I need to find out if the ActiveWarehouse doesn’t just return this data in xml format by using it’s build-in classes.
In Flex the OLAPCube can be loaded with the XML
var data:ICollectionView = new ArrayCollection(result.records.record); // is Array
cube.dataProvider = data;
cube.addEventListener(CubeEvent.CUBE_COMPLETE, creationCompleteHandler);
cube.refresh();
Once the cube is loaded you can slice and dice it in many ways by using an OLAPQuery. I still need to figure out all the possibilities which are offered.
[Bindable]
private var cubeResult:IOLAPResult;
private function creationCompleteHandler(event:CubeEvent):void
{
//Cube was created, let’s query it
var query:OLAPQuery = new OLAPQuery;
// TIME DIMENSION
var yearSet:IOLAPSet = new OLAPSet;
yearSet.addElements(cube.findDimension(“Time”).findAttribute(“Year”).members);
var quarterSet:IOLAPSet = new OLAPSet;
quarterSet.addElements(cube.findDimension(“Time”).findAttribute(“Quarter”).members);
//year-quarter
var newTimeSet:IOLAPSet = yearSet.crossJoin(quarterSet);
// AUTHOR DIMENSION
var authorSet:IOLAPSet = new OLAPSet;
authorSet.addElements(cube.findDimension(“Author”).findAttribute(“Name”).members);
// ROW/COLUMNS
var rowAxis:IOLAPQueryAxis = query.getAxis(OLAPQuery.ROW_AXIS);
rowAxis.addSet(authorSet.hierarchize(true));
var colAxis:IOLAPQueryAxis = query.getAxis(OLAPQuery.COLUMN_AXIS);
colAxis.addSet(newTimeSet.hierarchize(true));
// QUERY CUBE
var token:AsyncToken = cube.execute(query);
token.addResponder(new AsyncResponder(displayResult, olapFaultHandler));
}
private function displayResult(result:Object, token:Object=null):void
{
cubeResult = result as IOLAPResult;
}
The cube result is the dataProvider of the Cube which in it’s simplests form can be defined as follows:
I’ve then added a change listener for the grid to create the dataProvider for the ColumnChart.
[Bindable]
private var chartData:Array;
private function gridSelectionChanged():void {
if (!(olapGrid.selectedItem is OLAPAxisPosition)) return;
var rowIndex:Number = olapGrid.selectedIndex;
var axis:IOLAPQueryAxis = cubeResult.query.getAxis(OLAPQuery.COLUMN_AXIS);
var columnLength:Number = cubeResult.getAxis(OLAPQuery.COLUMN_AXIS).positions.length;
var newChartData:Array = [];
for (var i:int=0;i<columnLength;i++) {
var tuple:OLAPTuple = axis.tuples[i];
var key:String = tuple.explicitMembers.toArray().join(“,”);
if (key.indexOf(“(All)”) > -1) continue; newChartData.push({key:key, value:cubeResult.getCell(rowIndex, i).value});
}
chartData = newChartData;
}
This code to extract a time serie for the chart is a little “hairy”. I hope the Flex team has some OLAPCharts on their todo list ;-)
This are my first tribulations with both frameworks. Over the next few month I will have to dive more deeply into the possibilities which are offered. Thanks to both teams as this is pretty cool.
Enjoy!
Daniel.
Daniel Wanja
HTML5, iOS and Ruby On Rails Nouvelles Solutions, Inc.
d@n-so.com

