Graphs with Gruff
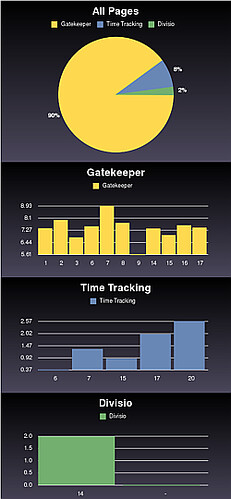 |
class GraphController < BaseTimeController def pages g = Gruff::Pie.new(“500×350”) g.title = “All Pages” @current_user.pages.each do |page| g.data(page.title, [page.total]) end send_data(g.to_blob, :disposition => ‘inline’, :type => ‘image/png’, :filename => “timers.png”) end end Pretty easy! Wasn’t it. Note the code above shows only the first of the graphs. Now if only I could find out how to set the minimum of the Bar chart to 0 instead of the minimum of the serie. Any help is appreciated? |
Daniel Wanja
HTML5, iOS and Ruby On Rails Nouvelles Solutions, Inc.
d@n-so.com

